Unlocking Success in the Mobile Gaming World: A Comprehensive Guide to Key Performance Indicators (KPIs)
Ejesh Soyunova | 4 min.

In the dynamic realm of mobile gaming, success is not just about creating a compelling game but also understanding how it performs and resonates with players. This is where Key Performance Indicators (KPIs) come into play. In this comprehensive guide, we’ll explore the various categories of KPIs crucial for evaluating the success and profitability of your mobile game.
Mobile game KPIs are quantifiable metrics that provide insights into your game’s performance. These metrics are categorized based on specific parts of the user journey you’re assessing. Understanding and tracking these KPIs is essential for making informed decisions and optimizing your game for success.
Downloads: The foundation metric that indicates how popular and successful your game is. A stellar marketing strategy is crucial to increase downloads.
User Growth Rate: Understanding the rate at which your user base grows and attributing growth to specific events or campaigns is crucial for sustained success.
User Retention Rate: A significant engagement metric, it reveals the percentage of players returning after a specified time. Mostly we keep track of day 1, day 7, and day 30 and if a game has a day-1 User Retention Rate of 30% or more, that is considered excellent. Anything less than 20% is not that good.
Average Session Length (ASL): The average duration of a single gaming session. It tells you how long users play a game, from the time the session starts (a player opening the app) until it finishes (the app is closed or sent to the background).
Playtime: Total time spent playing the game per day, that means all the sessions in a day are combined.
Install Ratio: Percentage of daily active users launching the game for the first time, providing insights into the effectiveness of user acquisition.
Daily Active Users (DAU): The number of users engaging with the game daily, reflecting the game’s success and stickiness.
Monthly Active Users (MAU): Similar to DAU, but on a monthly basis, offering a broader perspective on user engagement.
Stickiness: DAU to MAU ratio, indicating how many monthly active users engage with the game daily.

Reveals the number of users who stop using or uninstall your mobile game. Naturally, you’d want the churn rate to be as low as possible.
Churn Rate Reveals the number of users who stop using or uninstall your mobile game. Naturally, you’d want the churn rate to be as low as possible.
 3. User Acquisition KPIs Cost Per Install (CPI)
 The price you pay when a user installs the game after viewing an ad. The lower the CPI the better, which means you paid less to gain a player for your game.
 Cost Per Click (CPC)
 In this case, you pay when a user clicks on your in-app ad.
New UsersIndicates the average daily new installs, reflecting game popularity and user acquisition campaign performance.
Geographic LocationUnderstanding user locations helps optimize user acquisition and impacts monetization strategies.
DemographicsAnalyzing user characteristics such as age, gender, and interests aids in targeting specific audiences.
Return on Investment (ROI)Calculates the profit from marketing investments, aiding in evaluating campaign effectiveness.
 4. Monetization Mobile Game KPIs Average Revenue Per User (ARPU)
 Indicates the average revenue generated per user. The revenue includes money from in-app purchases,subscriptions, ads, etc.
Average Revenue Per Daily Active User (ARPDAU)ARPDAU is similar to ARPU. However, average revenue per daily active user focuses on users who play your game every day.
Time to First PurchaseReveals the time between installation and the first in-app purchase.
Lifetime Value (LTV)This is one of the most important monetization mobile game KPIs. It tells you the total revenue a user has generated for you during their lifetime.
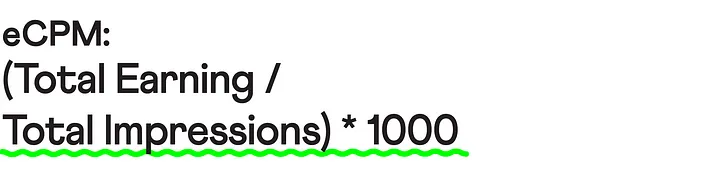
eCPM (Effective Cost Per Mille)Monitors revenue per 1,000 ad impressions, providing insights into in-app ad strategy performance.